Tuesday 28 July 2015

Curve Stitching

Definitely my most bizarre sketch....


...there's a logical explanation - honest!

Curve stitching is just cool - you start off with straight lines and pretty quickly you get what looks like a curve - its calculus anyone can understand.


String Art - mathcraft

So as a last day of term activity I got students making some designs using curve stitching - we watched this demo, they gave it a go using these templates (courtesy of Mr Chad) and then  progressed onto creating their own designs - It was going down pretty well.

Whilst they were working away I thought it would be interesting to have a go at creating some string art on GeoGebra - I started off with creating the first pattern they had made. It was pretty interesting as I had my screen projected all the time I was doing it and some of the class started to catch on with what I was doing - when I moved the slider a few jaws dropped - " how did you do that"..."algebra!". 


Of all  the times (and there have been a lot!) that I have tried to explain the power of algebra for designing and problem solving I was surprised to see this was the thing that hit it home more than anything. Maybe the reason was that I wasn't actually trying to teach them anything - they just noticed what I was doing and were genuinely interested to learn how - if you can achieve this in a lesson that's a definite success!

I showed them how I had used an equation to create a simple linear sequence that is the basis of the sketch and explained how the coordinates and the line segments are all defined using this sequence. They could really see here how defining objects by using letters (variables) rather than just numbers was powerful.  By the way, the sequence command can be used to sequence all sorts of objects in GeoGebra which makes it an essential command to get to grips with if you want to advance your GeoGebra skills.


I had a look on GeoGebraTube to see if anyone had put any other curve stitching sketches up that demonstrated a generalized form of the the curve stitching patterns some of the other students were sketching. Sure enough I found this nice sketch from Anthony;


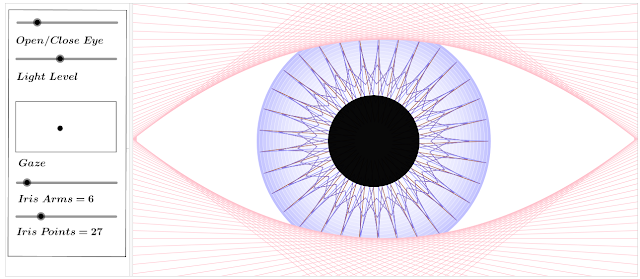
Alright so most of the class were impressed by this but the inevitable next questions came..so what, whats the point of this? Why would you ever need to do this? We talked about how algebra forms the basis of CGI  - a couple of students had already said that their curve stitching pictures looked like an eye so I picked on this as an example. We discussed how time consuming it would be to redraw the eye of an animated character in a film every time it adjusted, instead you could make a model based on algebra that could be controlled by changing a few values - yeh but that doesn't really look like an eye sir...I bet you can't make an actual eye. Well after this I had to try! 

Next time I do this  I will have to get the students creating some of their own designs using GeoGebra as some of them were desperate to abandon the paper and pencil approach after I'd shown them my sketch - I'd definitely created a Dan Meyer style headache. I came across this sketch which features some custom curve stitching tools that the prolific contributor John Golden has shared.


The ability to create custom tools like John has done here is a fairly advanced feature of GeoGebra that I will talk about in more detail at a later date but it is very useful when it comes to designing worksheets for students to use.Maybe I will try to figure out a way to get them to start creating their own simple designs from scratch before making it too easy for them with these tools!


So what started as a bit of a fun end of term lesson whilst I got on with a little classroom tidying, turned into one of the most engaging discussions I've had with students about the uses of algebra - thanks to GeoGebra.


Wednesday 22 July 2015

Single Graph Transformations


I felt like I was jumping the gun a bit with my last post by talking about successive transformations so I thought I aught to take a few steps back. Single step transformations are something I've taught several times to GCSE classes and as part of C2. Some things I've learnt work well are;

1. FOCUS ON GROUPING

As a first task before even looking at any graphs I get pupils to organise the following transformations into sets of first two and then three groups as they see fit:


Getting students to group the transformations gets them carefully examining the equations for similarities and differences and encourages them to look for some structure in something unfamiliar. Later it provides a framework with which to help them understand the different properties of transformations and helps with recalling them. Here is a handout.

For more able groups or as an extension you can add some extras (obviously these need to be considered later anyway but I've found that to much to soon can muddy the picture);


An interesting misconception that often comes out here is that the equations containing  $y=f(x-a)$ and $y=f(x)-a$ should be grouped with $y=-f(x)$ and $y=f(-x)$. They expect because of the presence of the negative symbols these should all belong to one group although mathematically this is hard to justify; at this stage of the lesson I wouldn't correct them but towards the end of the lesson I would draw on this misconception and discuss how $y=-f(x)$ can be considered a special case of $y=af(x)$ with a coefficient of -1.


2. DEVELOP UNDERSTANDING

One approach to demonstrate the effect of the different transformations is to create some tables of values for different functions and plot them (handout here*). This method provides some valuable practice of substitution (which you may need to teach/review first) and is a good way to examine the effects of transformations on specific coordinates. Transformations parallel to the y-axis are intuitive and easily explained and understood but those parallel to the x-axis require more careful thought. Through this activity students can look at the relationships between the rows in the tables and think about why transformations parallel to the x-axis turn out the way they do. This is a challenging concept though so I also like approach it from another angle.

I really like Dan Meyer and Buzzmaths's collaboration; graphing stories. These videos are fantastic for developing an understanding of graphing and they can be extended to the topic of transformations. I like to use 'Height of Waist off Ground'. Play the first part of the video a couple of times and get students to plot the graph (do not use the half speed section). Then play the solution and get them to check it.

"Imagine you are able to look into the future by four seconds. You're watching the scene but seeing whats happening four seconds in the future, so at t=0 what will you see?" Replay the video and ask pupils to plot what they are seeing. "which way has the graph shifted?... If we define waist height above ground as $f(t)$ then what graph have you drawn?.... $f(t+4)$."

"Now imagine again your watching the scene but this time, time in the scene is moving twice as fast so it's as if everything your seeing is moving at double speed, draw what you would see"..."Describe the transformation in words"..."what about in terms of $f(t)$"..."$f(2t)$."

The nice thing about this activity is that without doing any 'real maths' it provides an intuitive understanding of x-direction transformations that students can recall.

3. EXPLORE, INVESTIGATE FURTHER AND STRUCTURE FINDINGS

Calculating tables of values and drawing by hand is pretty tedious but in an ideal world it would be nice to do this for lots of values of 'a' and several functions. This is where graphing software is invaluable.

This simple sketch enables students to put in any function they like and explore what happens as 'a' is changed. This works well in pairs. One student types in a function, and asks the other a 'what will happen if ...?' type question and then checks it using the sketch. Encourage students to be really pedantic when it comes to scrutinizing their partners description. 


Finally I ask students to revisit their diagrams from the first task and consider if they sorted them in the most useful way. To help with this I get them to add the following descriptions into their groups where each description can only be used once but some groups will contain more than one description. Once they have completed this task they can add annotations to their diagrams to explain how to sketch and describe each transformation.


The following diagrams essentially summarize everything they need to know and the groupings make the various transformations easier to understand and remember.


One final thing that I have to mention on this topic is how great Desmos is for transformations.


Desmos is very straight forward to use, it makes graphs look fantastic without any fiddling around. Something like this takes literally 30 seconds to make - find out how here. I really like the table of values feature; you can edit the type of transformation by clicking in the column header. So simple!


* This handout was adapted from TES contributor Kevin Bensley.


Sunday 19 July 2015

Successive Transformations

Year 12 returned from their AS study leave a couple of weeks ago and we have started to teach some C3 topics; Successive Transformations, Functions and 'e & ln'. This is new territory for me as a teacher so I've been playing around with making a few new sketches in GeoGebra to tackle these.

The topic of graph transformations contains quite a few concepts for students to get their heads around and things start to get even more complex when combinations of transformations are applied in succession.

I made the following sketch to help.


You could use this sketch at the board or better get students using it. Use the input box to enter a function. Use one of the four options at the bottom of the right-hand screen and the sliders to select a new function based on the original (use a = -1 for a reflection). Now consider the two possible sequences of transformations that you could apply to reach the new function; use the check boxes to reveal the graphs of the successive transformations; do they both work?

Consider the order that transformations in succession are carried out in:

When is the order important, when is it not? 
In which cases do you need to translate then stretch and when should you stretch and then translate? 

Test out your ideas on some different functions.

The key points that came out in our discussions were;

1. If you consider transformations as belonging to one of the following two families:


The order must be carefully considered when transformations are combined from the same family "in-breeding can lead to complications!".

2. When transformations combined are from separate families the order isn't important as they affect the x and y values independently.

3. Just as transformations from the blue family are highly intuitive, so is the order that transformations should be carried out in i.e. $y = 2f(x) + 3$ is a stretch of a scale factor 2 parallel to the y axis followed by a translation of 3 units upwards. On the other-hand as transformations in the green  family do not execute as you may first expect, combinations from this family are also not so intuitive i.e.$y = f(2x+3)$ is a translation 3 units to the left followed by a stretch with a scale factor 0.5 parallel to the x-axis; so the 'expected' order is reversed.

The sketch allows students to examine why these point are so, algebraically as well as graphically.


Monday 13 July 2015

Question Time

Last Friday, just before the bell one of my year 12 students gave me the following problem:

"How many times a day are the minute and hour-hand perpendicular?"

I knew the student too well to respond with the first number that came into my head. The solution to this problem was evidently the subject of an intense debate between several students and this carried on down the corridor after the class were dismissed.

I'm sure like many maths teachers, when I'm posed with a problem my first instinct is to turn to algebra. After a bit of head scratching I managed to formulate an equation and soon after I had the solution.

Non of the maths I used was particularly difficult, in fact nothing beyond KS3 but I know how challenging students find it to translate a problem like this into algebraic terms or indeed any line of logical reasoning.  I thought it would be interesting to try this problem with my fairly middle of the road year 10 group to see what approaches they would take. I knew they would find it difficult to visualize the solution so I decided to knock up a GeoGebra sketch to help (spoiler alert!):


All of the students came up with 48 pretty quickly and they were pretty resolute when I told them they were wrong; 

"There are two in each hour and then 24 hours in a day so there must be 48, how can that be wrong?"

At this point I was glad of my GeoGebra sketch for some back-up as I was struggling to get them to reconsider looking at the problem from another angle and they were starting to lose interest. I actually decided to show them the solution and ask them the more interesting question - Why is it 44? 

After some more thinking time and discussion someone worked out that the key thing is how many times the the minute hand passes the hour hand within the 12 hours. "Ignore the ticks (the numbers) and just work out how many times the minute hand overtakes the hour hand, its got to be double that". This is a neat way of looking at it that seems so obvious once you see it but I also wanted to see if they could think it through algebraically so I encouraged them through my solution:

The total angle between the hands in minutes is given by;

$t - \frac{t}{12}= \frac{11t}{12}$

Which is a right-angle when equal to any integer in the sequence;

$30n-15$

Substituting;

$t=60×24=1440$

and solving for $n$ gives $n = 44.5$

Again the GeoGebra file helps to clear up where the point 5 comes from and why the answer is 44.

GeoGebra is a  fantastic tool for helping students to visualize problems that they find hard to access. This visualization can encourage geometric ways of thinking about and solving problems but it can also be used as a scaffold to the explore algebraic lines of thinking as I chose to do here.

I like this problem; there are many ways you can approach it and anyone who can tell the time on an an analogue clock can have a go at it. The obvious extension task is to ask at what times does 'perpendicular time' occur and then the second hand opens another can of worms. Try it with some of your classes and see what approaches they take. 

P.S. Designing a clock in GeoGebra would be a great little problem for further maths students studying polar coordinates and parametric equations.


Wednesday 8 July 2015

Equivalent Fractions

This week I delivered a training session on GeoGebra to my department, I showed them a variety of different sketches to illustrate how GeoGebra could be used to teach topics from each of the four main areas of the KS3/4 curriculum; algebra, geometry, data and number. We looked at linear graphs, transformations and cumulative frequency distributions but I think it was the fractions sketches that were the most popular.

A colleague who is full of creative teaching ideas and who has been teaching for many years told me that one sketch in particular was possibly the best single resource that he'd ever seen for teaching fractions - that made me smile so I thought I'd better share it here.


Experiment with manipulating the blue sliders to change the left hand fraction. "Will the fraction be bigger or smaller if I increase the numerator"..."Why do you say that?... What will happen to the picture?" demo "What if I increase the denominator ...",  "What if I reduce the denominator so that its less than the numerator?" 

I have used this demonstration several times with different ability groups and students always find these seemingly simple questions very challenging - they really get to the heart of understanding fractions.

Now onto the idea of equivalent fractions...Use the green sliders to perform an operation on the numerator and/or the denominator. "If I double the numerator whats going to happen"  demo, reset "If i double the denominator whats going to happen" demo, reset "What if I double both?"..."Surely not that's crazy we're doubling both the numerator and the denominator; all that effort and the fraction's going to remain the same size. Why is that?" You can use the verify slider to double check the fractions overlay exactly - especially useful when it's a close call.

Rack up the values on the blue fraction a bit and then switch the operation to division and you can explore look at the idea of simplifying fractions.

Great that all works nicely, time for some addition ... "What if I add two to both the numerator and the denominator"..."eh"..."Why doesn't that work?" Ah, if only we lived in Farey Land, our lives as maths teachers would be so much easier!

There are so many questions you can ask with this simple tool that really probe students understanding of equivalent fractions; you can use it at the board or get the students using it independently. My colleague and I were discussing after the session that we should use this for the AS level transition lessons we run in September.We find that even at A-level some students have serious problems when it comes to algebraic fractions as they don't have a basic conceptual understanding of what a fraction is and how they can/cannot be manipulated. I can't think of many other types of resource that you can use from KS2 right the way up to KS5 - I will post up some more of the sketches I use to teach fractions in the near future.

Monday 6 July 2015

y = mx + c (part 3)

The link at the base of my first post should have landed you at the GeoGebra Tube applet page (y = mx + c). Geogebra applets are great for students to experiment with or for teachers to use who aren't that confident with GeoGebra. They allow access to a GeoGebra sketch without opening the full program so although they offer limited functionality compared with opening the sketch in the program, they are very simple to use and display.

To try out the ideas in this post you will need to open up my sketch in the full program (the Chrome App or GeoGebra Applet do not offer full functionality of the second sketch I will share). One way to to do this is to click on the share or copy link at the bottom of the applet page. You then have the option to download the sketch as a GeoGebra file:


I should add at this point that if you haven't already done so you will need to download GeoGebra to open this file; you can do this here.

Ok, so after recapping some of the questions I asked in the first lesson on y = mx + c this is how I would develop students knowledge through questioning whilst using the following sketch;


Click on the background then hold down shift and use the right/left keys to zoom in/out on the x-axis only (up/down controls the y axis zoom). Is the gradient of the line still the same? Zoom the axes back to how they were.

Can you give me the equation of a line parallel  to this one? - Use the input bar to enter an equation and check. I have included a "clear" button in the sketch to quickly delete any additional lines (this is especially useful if the sketch is accessed as an applet as you can't just click on the line and press delete).

Before the next question hit clear, hide the axes labels and change the original equation using the sliders.

Can you give me the coordinates of a point on the line? - Enter the coordinates in the input bar; multiple points can be entered and the 'Show Point Coordinates' button used to, well you guessed it ... show coordinate points but it also colours incorrect points red for clarity. When you want to change the equation use the "clear" button to declutter.

When we're ready to move onto perpendicular lines I'd click the line tool, select an integer point on the line and then invite a student to select a second point such that the line drawn will be perpendicular - I'd check the gradient using the slope tool ask; Is their a link between the gradients of the two lines? 


Time to introduce another sketch; 


I'd explain to the students that this time I have defined the red line such that it’s always perpendicular to the blue line. I'd demo this by changing m1. This sketch uses the spreadsheet view of GeoGebra to record the gradients of both lines so that the relationship between them can be examined. To toggle record to spreadsheet 'on/off', click both of the grey/red buttons at the top of columns one and two.


I like to start from m1 = 1, record up until m1 = 8 then toggle record off. I'll then ask the students to look for a rule connecting m1 and m2. Next I'd toggle record off and move the gradient slider to -1 and then toggle on and record through to m1 = -8; does your rule hold for negative gradients? A further more challenging question is when won't this rule work and why?

Once you have the rules for parallel and perpendicular lines established you can explore a range of problems problems;

Can you give me the gradient of a line perpendicular to:

$y = 4x + 7$

$y = -\frac{x}{2} -2$

$y = -\frac{3x}{5}$


To show the last two lines using the sliders you will have to first change the increment setting for them. Right click on the slider and click Object Proprieties. You then have the option to change the increment. I originally set it as 1 to avoid generating an excessive number of values when recording, if you make it too fine its difficult to control using a small slider, 0.1 works well for what we are doing here. Incidentally I usually explain what I am doing to students when building or editing a sketch on the fly - I want them to see that the models we are using are dynamic and it's not just a series of pre-programmed tricks I am showing them. Often I will have to tweak something in a sketch or build a new one to respond to a question from a pupil.


Can you give me the equation of a line that is perpendicular to: 

$y=\frac{2x}{5}+2$

How many answers are there to this question?

Ok then how about the equation of a line that is perpendicular to the line 

$y=\frac{x}{2}+4$ 

that passes through the point (0,-3) ... How many answers are there to this question?

What about one that passes through the point (1,2).

As students propose answers to these questions I will use GeoGebra to check them at the board. You will notice that I have the sketch set-up to show the equations in decimal form (it is much more of a faff to show them with neat fractions embedded). I like to present the equations in the questions as fractions as this is an interesting discussion point and they understand that they can be displayed in both forms.

As always and comments, further ideas or questions are most welcome. 


Saturday 4 July 2015

y = mx + c (part 2)

Since the sketch I shared in my first post focused on linear graphs, I thought I would continue with this theme and share some ideas of how I might choose to develop this topic over the next few posts. Once students have a handle on how m and c affect linear graphs, here's a fun game they can play. If they have access to a laptop, tablet or even a smart phone then using a graph plotter is a good way for them to check their answers as this way they can see what's gone wrong if they make a mistake.


Each player needs a set of the cards (A-F) in a pile (I get them to cut their own out first). Playing in pairs or small groups students should all turn over the same card at the same time and try to write down the equations of all of the lines on it. Once each team member has written down their predictions or after an agreed time has elapsed the group can use a graph plotter to check if their equations are correct. One point is scored for each correct c value, one for each correct m value and one for an equation in the form x = a.  There are six rounds of the game and then early finishers can try and design some interesting cards of their own. The cards can then be stuck in books and annotated to explain any misconceptions.

If each group has access to a tablet or laptop a convenient way for students to access GeoGebra is via the new Chrome App (at the sign-in panel thy can click continue without signing in) . For this exercise they should select the algebra view and all they need to do is type in their equations in the left-hand panel. Once they have completed a card their equations can be selected and deleted to clear the screen. 


At a push students can use the Chrome App on a smartphone but Desmos which is an online graphical calculator has a much friendlier interface for small screens. Desmos is actually pretty sophisticated; if you start typing an equation into Desmos such as 'y = mx +c ' it will give you the option to set m and c up as sliders as in GeoGebra. Getting students access to laptops or tablets isn't always easy in my school so if I just want students to plot something up I usually get them to use Desmos. I know pupils in many schools now have access to tablets in every lesson -  I'd love to experiment with this in maths - I can imagine it would revolutionize the way I teach.


.

Friday 3 July 2015

y = mx + c


I was first introduced to GeoGebra in 2011 during my teaching training at the University of Leeds. I remember being shown how to use sliders to manipulate the x-coefficient and constant term in a linear equation that was controlling a graph. I was struck by the power of this demonstration for teaching links between functions and graphs. The graphical response of manipulating the m and c values was immediately apparent and with careful questioning a deep understanding of the mathematics at play could be obtained by a student in a matter of minutes. For a student to explore these relationships using a pencil and paper would take hours of graph plotting and even with a graphical calculator at their disposal the relationships would take much longer to explore and become clear. The session was only short but the snapshot of GeoGebra I’d seen was impressive.
Unfortunately I didn’t endeavor to actually use GeoGebra during my training year; I was too busy planning three part lessons, filling in paper work and writing essays. Indeed over three years passed before I saw it in use again, not in a school classroom but back in the same seminar room at the University of Leeds. This time, whilst enrolled on the excellent TAM course run by the MEI, I was shown how GeoGebra can be employed to help students obtain a deeper understanding of calculus (this will be the subject of a blog post in the near future).

I think there are several barriers aside from being very busy that meant I did not embrace GeoGebra sooner;
1.       Whilst I was impressed by what I had seen of GeoGebra whist training I was only shown its use in a fairly limited capacity – I was unaware of its amazing potential to aid in understanding a vast array of concepts linking number, geometry, algebra, statistics and calculus.

2.       I did not come across any teachers using GeoGebra at the schools where I trained or have worked and so I had little inspiration or support to develop its use in my teaching.

3.       Although there are a lot of excellent tutorials on the web on how to use GeoGebra and a plethora of GeoGebra worksheets available via GeoGebraTube, few authors have attempted to explain how they actually integrate GeoGebra into their day-to-day practice as teachers and use it as they cover different topics across the maths curriculum.

At the beginning of this year I took some time to really get my teeth into developing and using GeoGebra resources. Now, whilst I wouldn’t call myself an expert; if I can visualise a way to represent a mathematical concept - I can usually make it happen using GeoGebra and the result is generally far more eloquent, informative and engaging than I could achieve with a whiteboard and a pen.  My motivation for writing this blog is to allow you to look over my shoulder in the classroom, to share some ways in which I use GeoGebra and hopefully help some readers to overcome the three barriers that I have discussed. I welcome any comments, ideas, corrections or questions that you have relating to any of my posts or resources.
The first applet I will share here is a very simple GeoGebra sketch based on the one I was first shown that I have eluded in this post. Thanks for reading. 


Some suggested questions you might ask are:
What effect does changing c have on the graph?

What about m?

What can you say about the line if m is negative?

What will happen to the line if m is set to zero?

Can the line ever be vertical and if so how would you write down its equation?
Can you think of a way to find out where the line crosses the y-axis from the equation?

What about where it crosses the x-axis?

If you know the x-value of a coordinate point on the line how could you find its y-value? e.g. The point (3,A) lies on the line y = 3x + 10; find A.

If you know the y-value of a coordinate point on the line how could you find its x-value? e.g. (B,5) lies on the line y =2x - 15, find B.

How could you check if a particular coordinate point lies on the line using just its equation? e.g. Does the point (2,7) lie on the line y = 6x - 5?

If you were given two points how could you find the gradient of the line going through them? e.g. (5,2) and (3,1).

Could you then find the lines' equation?